Compute Blade Monitoring
Follow installation procedure for your operating system platform
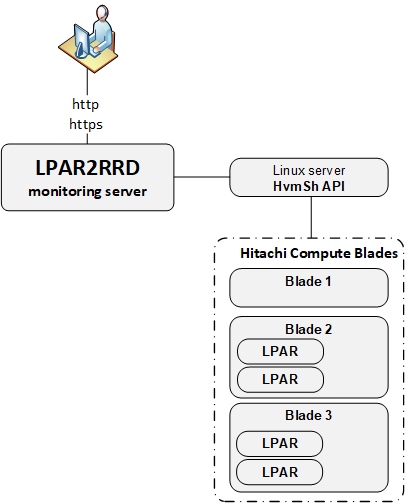
Implementation can be done in 2 scenarios:
- Hitachi HvmSh is installed on the LPAR2RRD server (it must be Linux)
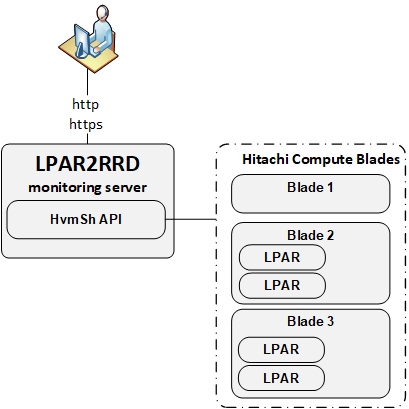
- Hitachi HvmSh in installed on any Linux server
Install HvmSh API
- Download from Hitachi site HVM Management Command package
- install it either on LPAR2RRD server (if it is running Linux) or whenever else on a Linux machine
It can be installed only on a Linux machine.
As install directory you can use /home/lpar2rrd/lpar2rrd/HvmShAPI/
-
Allow access from HvmSh API server to all HVM hosts on ports 623:UDP, 23250:TCP (in case of SSL 20670:TCP)
If you installed it on the LPAR2RRD server then you can check connectivity by:$ perl /home/lpar2rrd/lpar2rrd/bin/conntest.pl 192.168.1.1 23250 Connection to "192.168.1.1" on port "23250" is ok $ perl /home/lpar2rrd/lpar2rrd/bin/conntest_udp.pl 192.168.1.1 623 Connection to "192.168.1.1" on port "623" is ok
-
Install SSL certificates to allow HvmSh access your blades if needed (it is not required)
Use Hitachi documentation for that.
-
Allow IP access by setting: "HVM CLI1 IP Address" through telnet interface
-
Test connection to your blades, you need to run it twice, first attempt might end up with an error, ignore it
$ /home/lpar2rrd/lpar2rrd/HvmShAPI/HvmSh -host=<HVM host IP/hostname> get HvmPerfMon filename=/tmp/test.txt noconf nodetail exio
$ /home/lpar2rrd/lpar2rrd/HvmShAPI/HvmSh -host=<HVM host IP/hostname> get HvmPerfMon filename=/tmp/test.txt noconf nodetail exio
file /tmp/test.txt will contain performance data from your blade
LPAR2RRD OS agent
-
Install the latest LPAR2RRD OS agent on a host with HvmSh API installed
Download
Install
-
If HvmSh API is not directly on LPAR2RRD server then verify then allow network conectivity from HvmSh host to LPAR2RRD server on port 8162
$ perl /home/lpar2rrd/lpar2rrd/bin/conntest.pl 192.168.1.2 8162
  Connection to "192.168.1.2" on port "8162" is ok
- Test agent
/usr/bin/perl /home/lpar2rrd/agent/lpar2rrd-agent.pl -i <HVM host IP/hostname> -b /home/lpar2rrd/lpar2rrd/HvmSh <LPAR2RRD server>
- schedulle it in crontab like this:
* * * * * /usr/bin/perl /home/lpar2rrd/agent/lpar2rrd-agent.pl -i 192.168.1.1 -b /home/lpar2rrd/lpar2rrd/HvmSh 192.168.1.2 > /var/tmp/lpar2rrd-agent-hitachi.out 2>&1
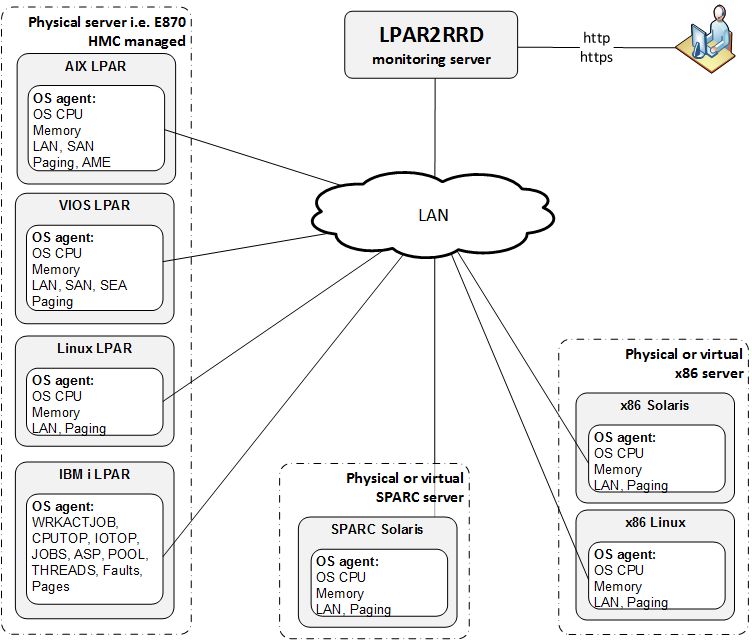
OS agent is add-on feature for monitoring from operating system level.
It is monitoring CPU, memory utilization, paging, LAN and SAN traffic on all adapters.
It requires the OS agent deployment to every monitored VM.
The agent is written in Perl and calls basic OS commands to obtain required statistics like vmstat, iostat.
 |
Additional information about the OS agent:
- OS agent description
- OS agent release notes and download
- Features supported by the OS agent.
- Solaris x86 OS agent
Prerequisites
- Perl
- Opened TCP communication between each VM and LPAR2RRD server on port 8162.
Connections are initiated from VM side. - Additional disk space on LPAR2RRD server (about 40MB per each monitored VM)
-
Create preferable dedicated user lpar2rrd on each VM with minimum rights
# useradd -c "LPAR2RRD agent user" -m lpar2rrd
OS agent installation (client)
-
Get the latest OS agent from download page
- Linux installation under root
# rpm -Uvh lpar2rrd-agent-5.00-0.noarch.rpm
# rpm -qa|grep lpar2rrd-agent
  lpar2rrd-agent-5.00-0
- Solaris x86 installation under root:
# gunzip lpar2rrd-agent-5.00-0.solaris-i86pc.tar.gz
# tar xf lpar2rrd-agent-5.00-0.solaris-i86pc.tar
# pkgadd -d .
  The following packages are available:
  1  lpar2rrd-agent     LPAR2RRD OS agent 5.00
                        (i86pc) 5.00
 ...
Solaris upgrade under root:# pkgrm lpar2rrd-agent # pkgadd -d .
- Schedule its run every minute from the crontab on every VM.
This line must be placed into lpar2rrd crontab:# su - lpar2rrd $ crontab -e * * * * * /usr/bin/perl /opt/lpar2rrd-agent/lpar2rrd-agent.pl <LPAR2RRD-SERVER> > /var/tmp/lpar2rrd-agent.out 2>&1
Replace <LPAR2RRD-SERVER> by hostname of your LPAR2RRD server.
-
You might need to add lpar2rrd user into /var/adm/cron/cron.allow (/etc/cron.allow on CentOS 8) under root user if above "crontab -e" fails.
# echo "lpar2rrd" >> /var/adm/cron/cron.allow
Troubleshooting
-
Client (agent) side:
-
Test if communication through the LAN is allowed.
$ telnet  <LPAR2RRD-SERVER> 8162
  Connected to 192.168.1.1   .
  Escape character is '^]'.
This is ok, exit either Ctrl-C or ^].
-
Check following agent files:
data store: /var/tmp/lpar2rrd-agent-*.txt
error log: /var/tmp/lpar2rrd-agent-*.err
output log: /var/tmp/lpar2rrd-agent.out
-
run the agent from cmd line:
$ /usr/bin/perl /opt/lpar2rrd-agent/lpar2rrd-agent.pl -d <LPAR2RRD-SERVER>
  ...
  Agent send     : yes : forced by -d
  Agent send slp: sending wait: 4
  OS/HMC agent working for server: <LPAR2RRD-SERVER>
  store file for sending is /var/tmp/lpar2rrd-agent-<LPAR2RRD-SERVER>-lpar2rrd.txt
It means that data has been sent to the server, all is fine
Here is example when the agent is not able to sent data :$ /usr/bin/perl /opt/lpar2rrd-agent/lpar2rrd-agent.pl -d <LPAR2RRD-SERVER> ... Agent send : yes : forced by -d Agent send slp: sending wait: 1 OS/HMC agent working for server: <LPAR2RRD-SERVER> store file for sending is /var/tmp/lpar2rrd-agent-<LPAR2RRD-SERVER>-lpar2rrd.txt Agent timed out after : 50 seconds /opt/lpar2rrd-agent/lpar2rrd-agent.pl:265
It means that the agent could not contact the server.
Check communication, port, above telnet example, DNS resolution of the server etc.
-
Test if communication through the LAN is allowed.
-
Server side:
- test if the daemon on LPAR2RRD server is running, and checking the logs
$ ps -ef|grep lpar2rrd-daemon
  lpar2rrd 10617010 1 0 Mar 16 - 0:00 /usr/bin/perl -w /home/lpar2rrd/lpar2rrd/bin/lpar2rrd-daemon.pl
$ cd /home/lpar2rrd/lpar2rrd
$ tail logs/error.log-daemon
$ tail logs/daemon.out
  new server has been found and registered: Linux (lpar=linuxhost01)
  mkdir : /lpar2rrd/data/Linux/no_hmc/linuxhost01/
It means that new OS agent has been registered from linuxhost01 (Linux stand-alone example)
-
Test if OS agent data is being stored on the LPAR2RRD server and have actual timestamp:
$ cd /home/lpar2rrd/lpar2rrd
$ ls -l data/<server name>/*/<VM name>/*mmm
  -rw-r--r-- 2 lpar2rrd staff  7193736 Mar 17 16:16 data/<server name>/no_hmc/<VM name>/cpu.mmm
  -rw-r--r-- 2 lpar2rrd staff  7193736 Mar 17 16:16 data/<server name>/no_hmc/<VM name>/lan-en1.mmm
  -rw-r--r-- 2 lpar2rrd staff 10790264 Mar 17 16:16 data/<server name>/no_hmc/<VM name>/mem.mmm
  -rw-r--r-- 2 lpar2rrd staff  7193736 Mar 17 16:16 data/<server name>/no_hmc/<VM name>/pgs.mmm
  -rw-r--r-- 2 lpar2rrd staff  7193736 Mar 17 16:16 data/<server name>/no_hmc/<VM name>/san-vscsi0.mmm
  -rw-r--r-- 2 lpar2rrd staff  3597208 Mar 17 16:16 data/<server name>/no_hmc/<VM name>/san_resp-vscsi0.mmm
$ find data -name mem.mmm -exec ls -l {} \;
  ...
- test if the daemon on LPAR2RRD server is running, and checking the logs
-
In case of a problem check our forum or contact us via support@lpar2rrd.com.
We would need this data for start of troubleshooting.
Notes
-
You will not need to upgrade LPAR2RRD agents regularly with each LPAR2RRD upgrade.
Read release notes if that is necessary.
Check OS agent upgrade steps.
Install LPAR2RRD server (all under lpar2rrd user)
-
Download the latest LPAR2RRD server
Upgrade your already running LPAR2RRD instance.
- Install it:
# su - lpar2rrd
$ tar xvf lpar2rrd-7.XX.tar
$ cd lpar2rrd-7.XX
$ ./install.sh
$ cd /home/lpar2rrd/lpar2rrd
- Make sure all Perl modules are in place
cd /home/lpar2rrd/lpar2rrd
. etc/lpar2rrd.cfg; $PERL bin/perl_modules_check.pl
If there is missing "LWP::Protocol::https" then check this docu to fix it
- Enable Apache authorisation
umask 022
cd /home/lpar2rrd/lpar2rrd
cp html/.htaccess www
cp html/.htaccess lpar2rrd-cgi
- Schedule to run it from lpar2rrd crontab (it might already exist there)
Add if it does not exist as above$ crontab -l | grep load.sh $
$ crontab -e

# LPAR2RRD UI
0,30 * * * * /home/lpar2rrd/lpar2rrd/load.sh > /home/lpar2rrd/lpar2rrd/load.out 2>&1
Assure there is just one such entry in crontab.
- You might need to add lpar2rrd user into /var/adm/cron/cron.allow (/etc/cron.allow on CentOS 8) if crontab command fails
Allow it for lpar2rrd user as root user.# echo "lpar2rrd" >> /var/adm/cron/cron.allow
-
Initial start from cmd line:
$ cd /home/lpar2rrd/lpar2rrd
$ ./load.sh
- Go to the web UI: http://<your web server>/lpar2rrd/
Use Ctrl-F5 to refresh the web browser cache.
Troubleshooting
-
If you have any problems with the UI then check:
(note that the path to Apache logs might be different, search apache logs in /var)tail /var/log/httpd/error_log # Apache error log tail /var/log/httpd/access_log # Apache access log tail /var/tmp/lpar2rrd-realt-error.log # STOR2RRD CGI-BIN log tail /var/tmp/systemd-private*/tmp/lpar2rrd-realt-error.log # STOR2RRD CGI-BIN log when Linux has enabled private temp
- Test of CGI-BIN setup
umask 022
cd /home/lpar2rrd/lpar2rrd/
cp bin/test-healthcheck-cgi.sh lpar2rrd-cgi/
go to the web browser: http://<your web server>/lpar2rrd/test.html
You should see your Apache, LPAR2RRD, and Operating System variables, if not, then check Apache logs for connected errors