Linux Monitoring
CPU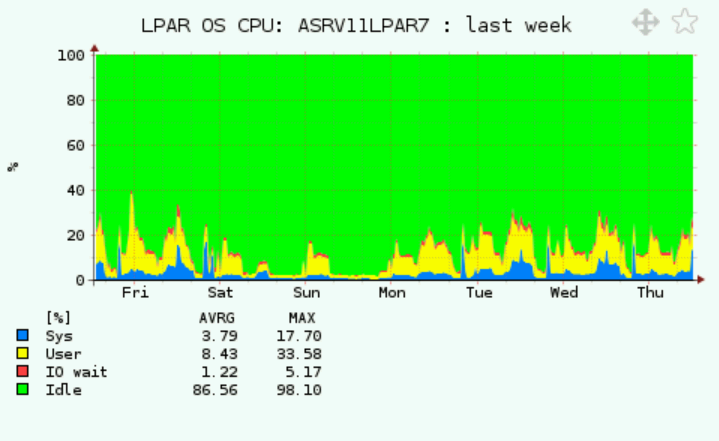 |
CPU Queue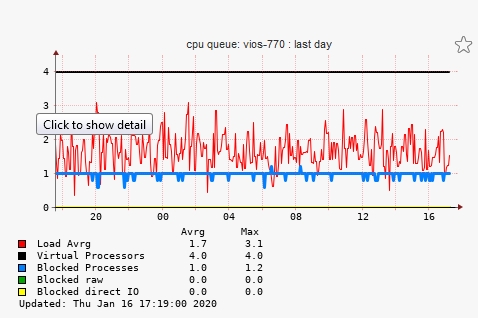 |
Memory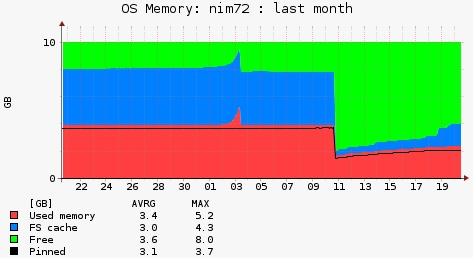 |
LAN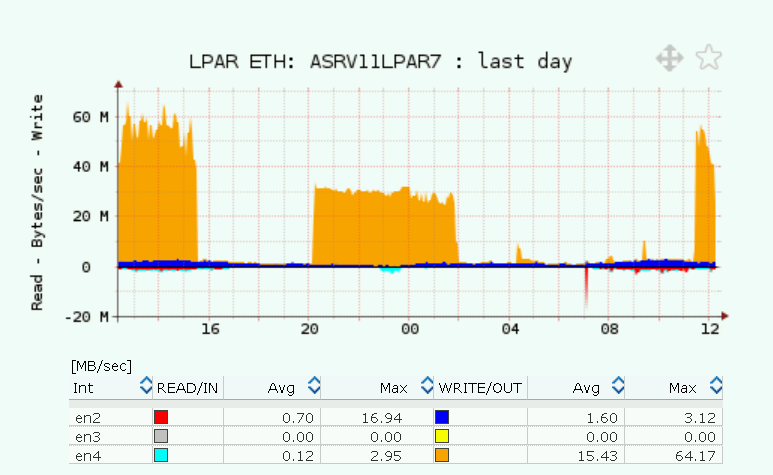 |
SAN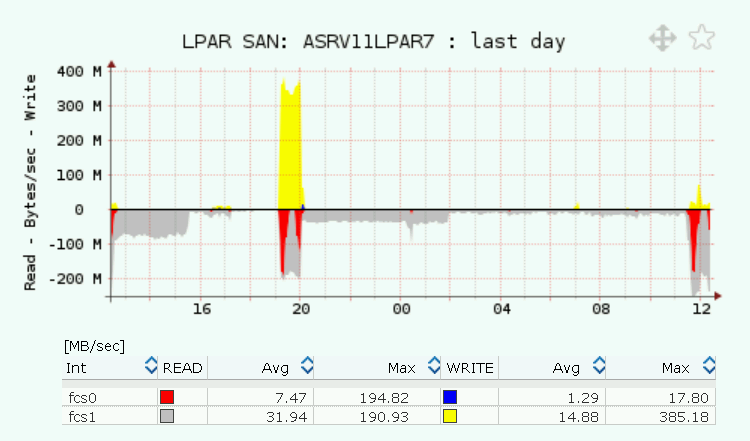 |
SAN IOPS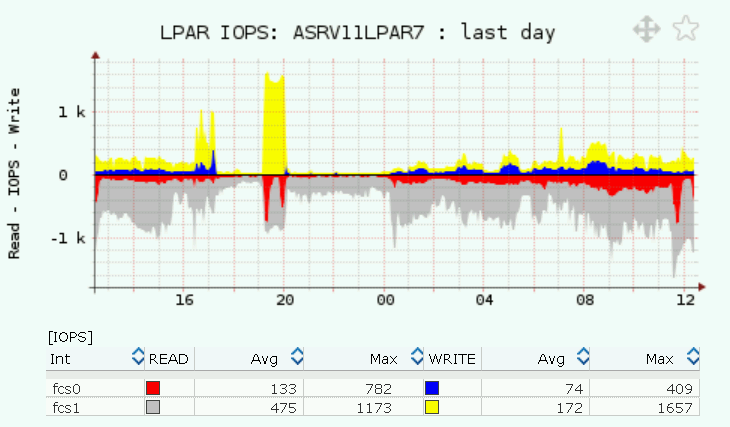 |
SAN RESP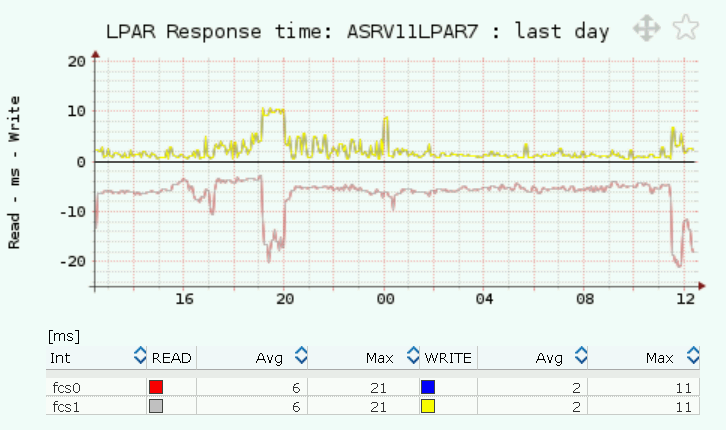 |
Monitored metrics
- JOB TOP, CPU and Memory tracking of running processes graphically in the time
- OS CPU utilization of user/sys/IO wait/idle in %
- CPU queue : load average, blocked processes / raw / direct IO
- Memory utilization of used/FS cache/free memory in MB
- Paging rate in MB/sec
- Paging space utilization in %
-
SAN (FC & vSCSI) throughput per adapter
- data in MB/sec
- IO/sec
- response time (latency)
-
LAN (ethernet) throughput per adapter
- data in MB/sec
- packet count
- Filesystem capacity utilization
Implementation
it is implemented as simple client/server application.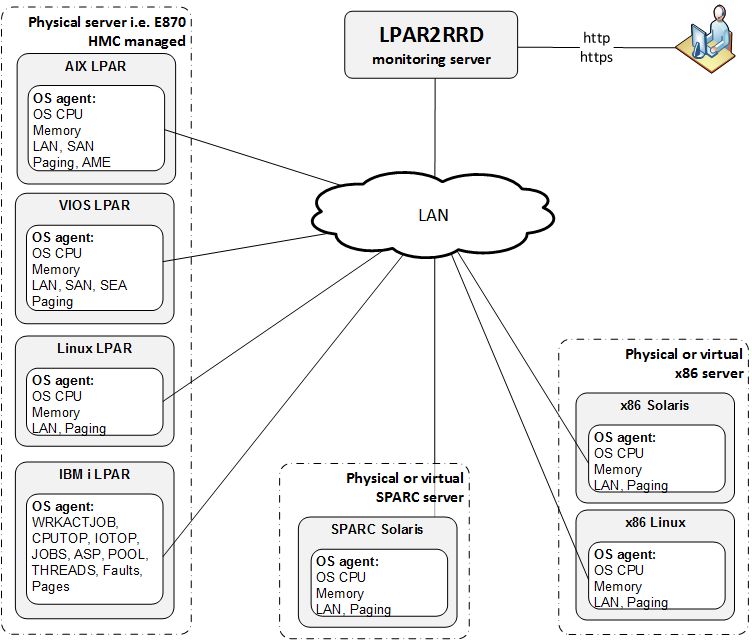 |
Each Linux has installed simple Perl based agent which is started every minute from the crontab and saves memory and paging statistics into a temporary file.
The agent contacts the server every 15-25 minutes and sends all locally stored data for that period.
Agent prerequisites
- Perl interpreter. All Unix/Linux systems contain Perl in basic installation.
- It might run under whatever user account, it does not need any special privileges in the OS.
- Opened TCP communication between each Linux host and LPAR2RRD server on port 8162.
- Connections are initiated from Linux hosts.
- Additional disk space on LPAR2RRD server (about 40MB per each monitored Linux)
OS agent release notes